
Missing in Action: Governor Scott Walker at National Governor’s Summer Meeting

It’s not that difficult figuring out why presidential candidate Scott Walker chose to opt out of attending the National Governor Summer meet Thursday through Saturday In West Virginia. Costs and controversies surrounding attempts to combat global warming are among topics the nation’s governors plan to tackle when they gather this week.
But because Walker believes 97% of scientists publishing papers on this subject are wrong, and he says human activity has no impact on the climate, he has little reason to attend this meeting.
This timely and urgently needed conference comes also as states grapple with issues that defy easy answers. Those include long-range funding for infrastructure upgrades, the effects of prolonged drought, and adequately funding public schools and colleges, to name a few.
It is likely that should Scott Walker become the next U.S. president, he will have to change his toon as the results of even worse global warming will already be upon us. We ought not wait for the next election to take massive actions and provide positive financial incentives to residents who cause limited or no amounts of contributions (greenhouse gas emissions to the atmosphere) to this potentially very real calamity. See “About This Blog” for one approach.
Who’s Gonna Stand Up and Save the Earth – Neil Young

Originally published on Sep 27, 2014, as requested by Neil himself. More than one version. “Please feel free to create any video of “Who’s Gonna Stand Up” u wish. Use social media to spread the word. – NY”
The above photo is of the Alberta, Canada area which was once boreal forest but was converted into a tar sands mine.
The Koch Brothers are the main owners. A Koch Industries subsidiary holds leases on 1.1 million acres in the northern Alberta oil sands, an area nearly the size of Delaware. The Washington Post confirmed the group’s findings with Alberta Energy, the provincial government’s ministry of energy. Koch Industries has been involved with almost every aspect of the tar sands industry, from mining bitumen to transportation, exportation, distribution and, of course, refining the petrochemicals — a large part of their empire.
Koch Industries is “one of Canada’s largest crude oil purchasers, shippers, and exporters, with more than 130 crude oil customers,” and is also responsible for about 25 percent of oil sands crude imports into the U.S., for use at its refineries, according to a Post article by Ari Philips, March 20, 2014.
Koch Industries on a net acreage basis is the largest American and foreign holder of leases in Canada’s oil sands.
The Enbrige owned pipeline cuts diagonally across Wisconsin from Superior to the border with Illinois The Wisconsin Department of Natural Resources (DNR) approved its permit to triple the volume pumped through the current 42 inch pipeline to 1.1 million barrels (42-gallons) per day. Dane County added a condition to placing a pumping station on the Dane County that they appropriately insure the project in case of a spill like the one that occurred in 2012 in Kalamazoo, Michigan part but Wisconsin state legislators nullified that with language prohibiting local action. The Wisconsin DNR determined there was no significant environmental impacts warranting a public review and Environmental Impact Statement EIS.
Boreal Forest
Movement to Require GMO Labeling Dealt a Blow in U.S. House of Representatives

The GMO-labeling movement was dealt a major blow last week when Congress passed HR 1599, the Safe and Accurate Food Labeling Act. The bill, sponsored by Representative Mike Pompeo (R., Kan.), prohibits states from mandating labels on products with genetically modified ingredients and creates a voluntary certification system at the USDA.
Forty-five Democrats voted in favor of the bill. Voting “yes” to the bill were Wisconsin’s Paul Ryan, James Sensenbrenner, Glen Grothman, Sean Duffy and Reid Ribble. Voting “no” were Mark Pocan, Ron Kind and Gwen Moore.
NASA Captures “EPIC” Earth Image

A NASA camera on the Deep Space Climate Observatory satellite has returned its first view of the entire sunlit side of Earth from one million miles away.
This color image of Earth was taken by NASA’s Earth Polychromatic Imaging Camera (EPIC), a four megapixel CCD camera and telescope. The image was generated by combining three separate images to create a photographic-quality image. The camera takes a series of 10 images using different narrowband filters — from ultraviolet to near infrared — to produce a variety of science products. The red, green and blue channel images are used in these color images.
The image was taken July 6, 2015, showing North and Central America. The central turquoise areas are shallow seas around the Caribbean islands. This Earth image shows the effects of sunlight scattered by air molecules, giving the image a characteristic bluish tint. Once the instrument begins regular data acquisition, EPIC will provide a daily series of Earth images allowing for the first time study of daily variations over the entire globe. These images, available 12 to 36 hours after they are acquired, will be posted to a dedicated web page by September 2015.
The primary objective of DSCOVR, a partnership between NASA, the National Oceanic and Atmospheric Administration (NOAA) and the U.S. Air Force, is to maintain the nation’s real-time solar wind monitoring capabilities, which are critical to the accuracy and lead time of space weather alerts and forecasts from NOAA.
June 2015’s Global Average Temperature Highest in 136 Year Record, Breaking Previous Record High Temperature Record of June 2014
The combined average temperature over global land and ocean surfaces for June 2015 was the highest for June in the 136-year period of record, at 0.88°C (1.58°F) above the 20th century average of 15.5°C (59.9°F), surpassing the previous record set just one year ago by 0.12°C (0.22°F). This was also the fourth highest monthly departure from average for any month on record. The two highest monthly departures from average occurred earlier this year in February and March, both at 0.90°C (1.62°F) above the 20th century average for their respective months, while January 2007 had the third highest, at 0.89°C (1.60°F) above its monthly average.
June 2015 also marks the fourth month this year that has broken its monthly temperature record, along with February, March, and May. The other months of 2015 were not far behind: January was second warmest for its respective month and April was third warmest. These six warm months combined with the previous six months (four of which were also record warm) to make the period July 2014–June 2015 the warmest 12-month period in the 136-year period of record, surpassing the previous record set just last month (June 2014–May 2015). As shown in the table below, the 10 warmest 12-month periods have all been marked in the past 10 months.
This report follows earlier reports that last year global average temperatures were also the highest since the U.S. National Weather Service began recording temperature data on the planet.
Dew point temperature, which is the temperature of the air when the air is holding the maximum amount of water vapor it can hold, is used commonly by weather forecasters as a measure of how humid the air around us will “feel”. Humans are sensitive to changes in humidity in the air because our skin uses the air around us to get rid of moisture in the form of sweat; the evaporation of water uses heat energy thus ridding of the perspiration creates a cooling effect on the skin. If the relative humidity is very high, the air is already saturated with water vapor (at the dew point temperature) and the perspiration won’t evaporate. When this happens, we feel hotter than the actual temperature.
Dew point temperatures throughout the Midwest over the last century climbed steadily, according to a report by Jesse H. Wartman reported higher dew point temperatures (the maximum amount of water vapor (another greenhouse gas) that the air at any one place can hold) “I analyzed dew-point temperatures from the U.S. Upper Midwest over the period 1961-2005. Results show a significant increase in the past 44 years in the cities of Sioux Falls, Minneapolis, Omaha, Des Moines, Kansas City and St. Louis. The tendencies are apparent in monthly, seasonal and yearly averaged trends. Not only were the dew-point temperatures observed to be increasing, the number of extremely high dew points per year was observed to be increasing as well.”
10 Feet of Global Sea Level Rise Is Now Guaranteed

At least 10 feet of sea level rise is now guaranteed worldwide; it’s all but inevitable, a done deal. An ice sheet two miles thick has collapsed in West Antarctica. Glaciologists have been dreading this moment for decades, though in recent years, it was more of a question of when than if—and there is nothing that can stop it from melting now. Read more about it.
A new study finds that even if we slow rising temperatures now, we could still be in for higher seas.
Media Reports The World Will Enter A ‘Mini Ice Age’ In The 2030s; Actually, It’s the Reverse That’s the Real Truth!
U.K. tabloids, conservative media, and others are (mis)reporting that the Earth will enter a “mini ice age” in the 2030s. In fact, not only is the story wrong, the reverse is actually true.
The Earth is headed toward an imminent speed-up in global warming, as many recent studies have made clear, like this June study by NOAA. Indeed, a March study, entitled “Near-term acceleration in the rate of temperature change,” makes clear that a stunning acceleration in the rate of global warming is around the corner — with Arctic warming rising 1°F per decade by the 2020s!
Also, right now, we appear to be in the midst of a long-awaited jump in global temperatures. Not only was 2014 the hottest year on record, but 2015 is in the process of blowing that record away. On top of that, models say a massive El Niño is growing, as USA Today reported last week. Since El Niños tend to set the record for the hottest years (since the regional warming adds to the underlying global warming trend), if 2015/2016 does see a super El Niño then next year may well crush the record this year sets.
Whatever near-term jump we see in the global temperatures is thus likely to be followed by an accelerating global warming trend — one that would utterly overwhelm any natural variations such as a temporary reduction in solar intensity. A recent study concluded that “any reduction in global mean near-surface temperature due to a future decline in solar activity is likely to be a small fraction of projected anthropogenic warming.”
That’s true even for one as big as the Maunder Minimum, which was linked to the so-called Little Ice Age.
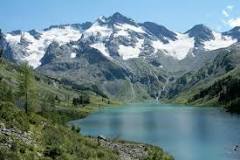
The “Little Ice Age” is a term used to cover what appears to have been two or three periods of modest cooling in the northern hemisphere between 1550 and 1850.
I know you are shocked, shocked to learn that unreliable climate stories appear in U.K. tabloids, the conservative media, and those who cite them without actually talking to leading climate scientists. Often there is a half truth underlying such stories, but in this case it is more like a nano-truth.
Last week, in Llandudno, north Wales, the Royal Astronomical Society (RAS) held Cyfarfod Seryddiaeth Cenedlaethol 2015 — the “National Astronomy Meeting 2015″ (in case you don’t speak Welsh). An RAS news release had this startling headline, “Irregular Heartbeat Of The Sun Driven By Double Dynamo.”
Okay, that wasn’t the startling part. This was: “Predictions from the model suggest that solar activity will fall by 60 per cent during the 2030s to conditions last seen during the ‘mini ice age’ that began in 1645.”
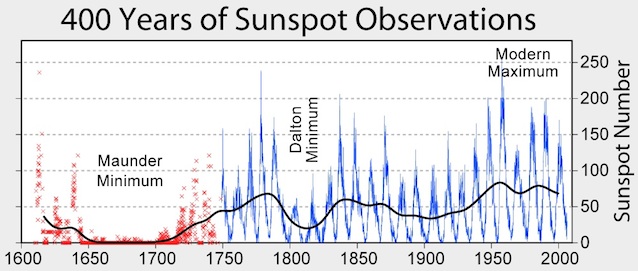
Ah, but the word choice was confusing. We’re not going to have temperature “conditions” last seen during the Little Ice Age. If this one study does turn out to be right, we’d see solar conditions equivalent to the Maunder Minimum in the 2030s.
This won’t cause the world to enter a mini ice age — for three reasons:
The Little Ice Age turns out to have been quite little.
What cooling there was probably was driven more by volcanoes than the Maunder Minimum.
The warming effect from global greenhouse gases will overwhelm any reduction in solar forcing, even more so by the 2030s.
So how little was the Little Ice Age?
The most comprehensive reconstruction of the temperature of the past 2000 years done so far, the “PAGES 2k project,” concluded that “there were no globally synchronous multi-decadal hot or cold intervals that define a worldwide Medieval Warm Period or Little Ice Age.”

Green dots show the 30-year average of the new PAGES 2k reconstruction. The red curve shows the global mean temperature, according HadCRUT4 data from 1850 onwards. In blue is the original hockey stick of Mann, Bradley and Hughes (1999 ) with its uncertainty range (light blue). Graph by Klaus Bitterman.
The Little Ice Age was little in duration and in geographic extent. It was an “Age” the way Pluto is a planet.
Writing on Climate Progress, climatologist Stefan Rahmstorf noted the researchers “identify some shorter intervals where extremely cold conditions coincide with major volcanic eruptions and/or solar minima (as already known from previous studies).”
That brings us to the second point: The latest research finds that what short-term cooling there was during the Little Ice Age was mostly due to volcanoes, not the solar minimum. As “Scientific American” explained in its 2012 piece on the LIA, “New simulations show that several large, closely spaced eruptions (and not decreased solar radiation) could have cooled the Northern Hemisphere enough to spark sea-ice growth and a subsequent feedback loop.” The period associated with the LIA “coincide with two of the most volcanically active half centuries in the past millennium, according to the researchers.”
The cooling effect from the drop in solar activity during even a Maunder Minimum is quite modest. Environmental scientist Dana Nuccitelli discussed the literature underscoring that point in a U.K. Guardian post from the summer of 2013, the last time the “Maunder Minimum” issue popped up.
That brings us to the third point: Whatever cooling the Little Ice Age saw as result of the Maunder Minimum, it pales in comparison to the warming we are already experiencing — let alone the accelerated warming projected by multiple studies. That’s clear even in Pages 2k reconstruction above.
Just last month “Nature Communications” published a study called, “Regional climate impacts of a possible future grand solar minimum.” This found that, “any reduction in global mean near-surface temperature due to a future decline in solar activity is likely to be a small fraction of projected anthropogenic warming.” As with the Little Ice Age, any significant effects are likely to be regional in nature — and, of course, temporary, since a grand solar minimum typically lasts only decades.
So, no, the Daily Mail is quite wrong when it trumpets, “Scientists warn the sun will ‘go to sleep’ in 2030 and could cause temperatures to plummet.”
In actuality, what is going to happen in the business-as-usual emissions scenario (RCP8.5) is closer to “rate of change” of warming.
Original story by Joe Romm on Climate Progress
Americans Are Driving and Flying at Unprecedented Levels, Adding to the Growing Accumulation of Greenhouse Gases that are Fueling Global Warming

Americans are driving more than ever before, adding to the growing amount of greenhouse gases in the atmosphere each time they get behind the wheel and start up the ignition. Newly released data from the U.S. Department of Transportation shows the estimated motor vehicle miles traveled on all the nation’s highways, roads and streets reached a new high in April 2015, the latest month data is available.
The more miles they drive, the more pounds of carbon dioxide their vehicle emits, adding to the already considered dangerous and growing volume of greenhouse gases in the atmosphere. Approximately 20 pounds of carbon dioxide (CO2) are produced from burning a gallon of gasoline and 22 pounds of CO2 are produced by burning a gallon of diesel fuel.
As if this weren’t bad enough, U.S. airlines (burning jet fuel, another fossil fuel) reported a seasonally-adjusted all-time monthly highs in passenger enplanements, Revenue Passenger-Miles (RPMs) and Available Seat-Miles (ASMs). Systemwide passenger enplanements in April (65.4 million) exceeded the previous record the previous month – March 2015 – by 0.4 percent. Systemwide RPMs in April – 73.8 billion – exceeded the previous systemwide RPMs in March 2015 by 0.4 percent.[U.S. DOT Bureau of Transportation Statisitics]
Air travel has been reported as America’s “biggest carbon sin”. It just got bigger! Shame, shame ….
Why Have Our Commercial and Public Media (TV, Radio, Newspapers, Magazines, Online Sources) and Officials in Federal and State Government in the United States Not Sounded the ALARM Yet on Continued Global Warming and Climate Change?


The following is a summary of a 2008 international conference entitled: “ENVIRONMENT: FROM GLOBAL WARNINGS TO MEDIA ALERT” that was held October 10 and 11, 2008, in Venice, Italy. The purpose of the conference was to challenge the international media to improve public understanding of the impact of climate change. Journalists and news executives from 29 countries representing six continents attended the conference which was held by the international World Political Forum (WPF).
Unfortunately, now almost five years after this conference was held, commercial and corporation funded TV and radio media in these United States continue to purposefully ignore said challenge by not sounding the alarm on the global warming world catastrophe in the making, as do many U.S. publicly elected government officials in federal and state government, leaving the at large public in the U.S. as confused as ever over whether human activities such as fossil fuel burning: in power plants that produce electricity; in home and business heating (natural gas; oil; propane; electric baseboard); in motor vehicle travel and product shipping, via trucks, ships, pipelines (fueling lift stations), in airplanes and in trains; and in cement making and paving the landscape (fuel burning in earth moving equipment). Another significant contributor to the growing global warming crisis is continued deforestation, worldwide, and especially the deforestation of the tropics, where previously large reductions in of carbon dioxide (CO2) were being taken out of the air by the vegetation there – through the process of photosynthesis. Less green vegetation on Earth means increasing buildup of CO2 in the atmosphere and oceans, adding to warmer global temperatures. Methane gas (unburned natural gas) that is released from oil wells, livestock, and rotting biological matter (permafrost thawing) compound the problem that is resulting in what the scientific community has called “a potentially very dangerous situation for all humanity and life on Earth and lasting far into the future. Reason is that many positive (lead to more warming) feedbacks . One such warming feedback is the loss of Earth’s albedo, where a reduction in the area of snow-covered land, ice caps, glaciers or sea ice has a compounding effect on the initial warming. As the loss of “white” snow and ice cover (the albedo) continues, the amount of solar energy absorbed by the ocean increases, leading to more warming, which reduces the albedo on the planet even more, which causes more warming, and so on. A small amount of snow melt exposes darker ground which absorbs more radiation, leading to more snowmelt.
The effect is most vividly demonstrated by the decline in Arctic sea ice in recent decades.

As humans are continuing to do things that add more heat-trapping greenhouse gases (GHGs) to the Earth’s atmosphere, the result is that climates all around Earth have been measurably and significantly changing, mostly to the detriment of humans and animal life.
The global warming that has already taken place has caused Earth’s ocean levels to rise – due to thermal expansion from increasing water temperatures and from melting glaciers on Greenland, Antarctica, and Earth’s numerous mountain ranges.
Ocean water acidification has already taken place (a 33% increase) which has already lead to significant environmental, economic, and social cost. These effects of expected to continue unabated which is expected to worsen in time, with projected increases in monetary losses, damage, and loss of human and animal life due to worse and worse “natural” disasters.
As examples of recent catastrophes suspected to have been made worse as a likely direct consequence of rising average global temperatures (global warming): in 2015 heat waves in India and Pakistan killed 1,400 and 2,500 people; in 2013, the thirtieth named storm of the 2013 Pacific typhoon season, Typhoon Haiyan — known as Typhoon Yolanda in the Philippines – with an estimated one-minute sustained winds of 315 km/h (196 mph; 170 kn), making the typhoon the strongest tropical cyclone ever observed based on one-minute sustained wind speed and the deadliest typhoon hitting the Philippines in recorded modern history, killing 6,300 people in that country alone (dozens of fatalities from the storm were also reported in Taiwan, China and Vietnam) and according to United Nation’s officials, about 11 million people were adversely impacted by the storm with many left homeless and an economic cost in the billions of dollars; in 2012, Hurricane Sandy, which remains the largest Atlantic hurricane on record (as measured by diameter, with winds spanning 1,100 miles (1,800 km)) is estimated to have caused monetary damages of over $68 billion and killed at least 233 people along its path on the eastern U S. seaboard including New Jersey and New York; and in 2005, Hurricane Katrina, the fifth hurricane of the 2005 Atlantic hurricane season, was not only the costliest “natural” disaster in the history of the United States. Total property damage from Hurricane Katrina was estimated at $108 billion; the hurricane and subsequent flooding took 1,833 human lives and an undetermined number of domesticated and wild animal lives.
Yet today, incredibly – almost six years later – there remain deniers of human-caused global warming and climate change, including our State of Wisconsin’s own U.S. Senator Ron Johnson, as well as announced U.S. presidential candidate and our current governor, Scott Walker, who continue to spread the false message that Earth’s climates have not been shown to have changed as a result of human activities, to the delight of corporations that are financially benefiting from continued and more fossil fuel burning, which releases carbon dioxide gas, the most abundant of the greenhouse gases, which compounds from year to year in the atmosphere and Earth’s oceans, leading to monumental negative consequences for humanity and other life forms on Earth.
WPF’s President Mikhail Gorbachev, the eighth and last leader of the Soviet Union and General Secretary of the Communist Party of the Soviet Union from 1985 until 1991 when the party was dissolved, chaired the conference at which participants reached a consensus that the problem of climate change is “URGENT”.
“Time is running out,” Mr. Gorbachev said in his closing remarks. “The most efficient way to tackle the urgent environmental problems facing our planet is transparency, in which the media have a vital role to play. This means global glasnost.”
Climate experts and media delegates approved a declaration calling for higher standards of reporting on strategic options to avert irreversible damage to the Earth’s eco-systems.
Stressing the importance of well-informed public opinion, the declaration set out the following main recommendations:
– The media have the central role in ensuring that politicians, corporations, non-governmental organisations and scientists keep the general public informed about the latest facts and policy options regarding climate change. Civil society formation and action are essential components in deliberation on this issue.
– Journalists have a responsibility to improve their knowledge and skills in order to be able effectively to question government policy-makers, to distinguish facts from opinion or advocacy, and to evaluate scientific arguments from an independent viewpoint.
– Journalists and civil society should redouble their efforts to combat restrictive measures by governments on journalists reporting on their deficiencies in fighting environmental degradation or in informing the public about the dangers of climate change.
– Journalists should avail themselves of existing international databanks of validated statistics and scientific research on climate change.
– Scientists need to acquire improved communications skills to explain their findings in accessible terms and to build relationships of trust with the media.
– Media proprietors should be prepared to invest more resources in investigative reporting to allow specialist journalists to carry out serious and objective coverage of complex issues, based on a thorough understanding of good science.
– Editors should provide more space for in-depth treatment of environmental issues, not just on-line but in print and on air, and encourage innovative approaches that will grab the attention of the audience in a responsible, independent and non-sensational manner.
– Journalism training organisations should develop ever more sophisticated exercises to improve reporters’ skills in explaining complex scientific arguments. An international network should be created to share information about the availability of training courses and the development of new training models.
The Conference concluded on a positive note, declaring: “There is, however, cause for optimism if we act now. Numerous positive solutions to the global environmental change proposed by science and made possible by innovations in technology, the potential inherent in global civil society organization and by citizens’ groups everywhere in the world; and contributions from socially responsible business leaders can make it possible for us to provide for a decent and full life for all, and for generations to come, within the limits of our planet’s resources.”
Congressional Action or Inaction on Impacts of Climate Change on Undeveloped Countries?

If carbon dioxide (CO2) was as visible as the colors of Old Glory, the color of the sky would be predominantly red, white and blue. That’s because over the last 100+ years, the United States has contributed more CO2 to the atmosphere (now considered a pollutant since additional CO2 adds to the atmosphere’s “greenhouse effect”) than any other of the world’s countries, including China.
None of the CO2 and other greenhouse gases emitted to the atmosphere from fuel burning the world over escapes the atmosphere to become outerspace; rather, it becomes part of the mix of gases already present tin the atmosphere for hundreds of years, making for an ever stronger greenhouse effect over time. And because the heat is latent in its expression, the warming effect of the combined total of all additional greenhouse gases emitted to the atmosphere during the first 15 years of the current century has not been fully realized. The warming effects of the first 15 years of this century are mostly the result of increased fuel burning in motor vehicles and jet air travel the period 1970 – 2000, along with burning coal and natural gas in electricity providing power plants.
Although China has recently surpassed the U.S. in estimated annual CO2 emissions, the U.S. is still considered the world’s largest historical emitter of CO2. The CO2 concentration in the atmosphere is important since any additional CO2 released to the atmosphere by fossil fuel burning adds to the strength of atmosphere’s greenhouse effect over time, adding to what would otherwise be a background concentration level of roughly 250 parts per million (ppm) in the atmosphere, the CO2 level present in the atmosphere prior to the initiation of wide spread fossil fuel burning which started during the Industrial Revolution. The presently now new globally averaged level of 400 ppm in the atmosphere is higher than at any other time in Earth’s history when humans were documented as being present. This is why the undeveloped countries of the world believe the United States has a special obligation to help their people cope with the impacts of the changing climate on them.
Next week, the Senate Appropriations Committee will consider the U.S. commitment to the Green Climate Fund for vulnerable people impacted by climate change. Are one of your senators on the congressional Appropriations Committee?
Pope Francis pointed out in his encyclical on ecology that it is the world’s poor who are bearing the brunt of climate impacts. As Americans, and as people of faith, we are obliged to advocate for those whose lives and livelihoods are threatened, and who cannot advocate for themselves.
The Green Climate Fund was conceived to help poor and vulnerable countries adapt to the unavoidable impacts of climate change like changing weather patterns, sea level rise, and extreme weather events while building more resilient societies. More than 30 countries have pledged $10.2 billion to get the fund up and running. President Obama has pledged $3 billion from the U.S., and requested the first installment of $500 million in this year’s budget. The U.S. Senate needs to deliver on that promise!
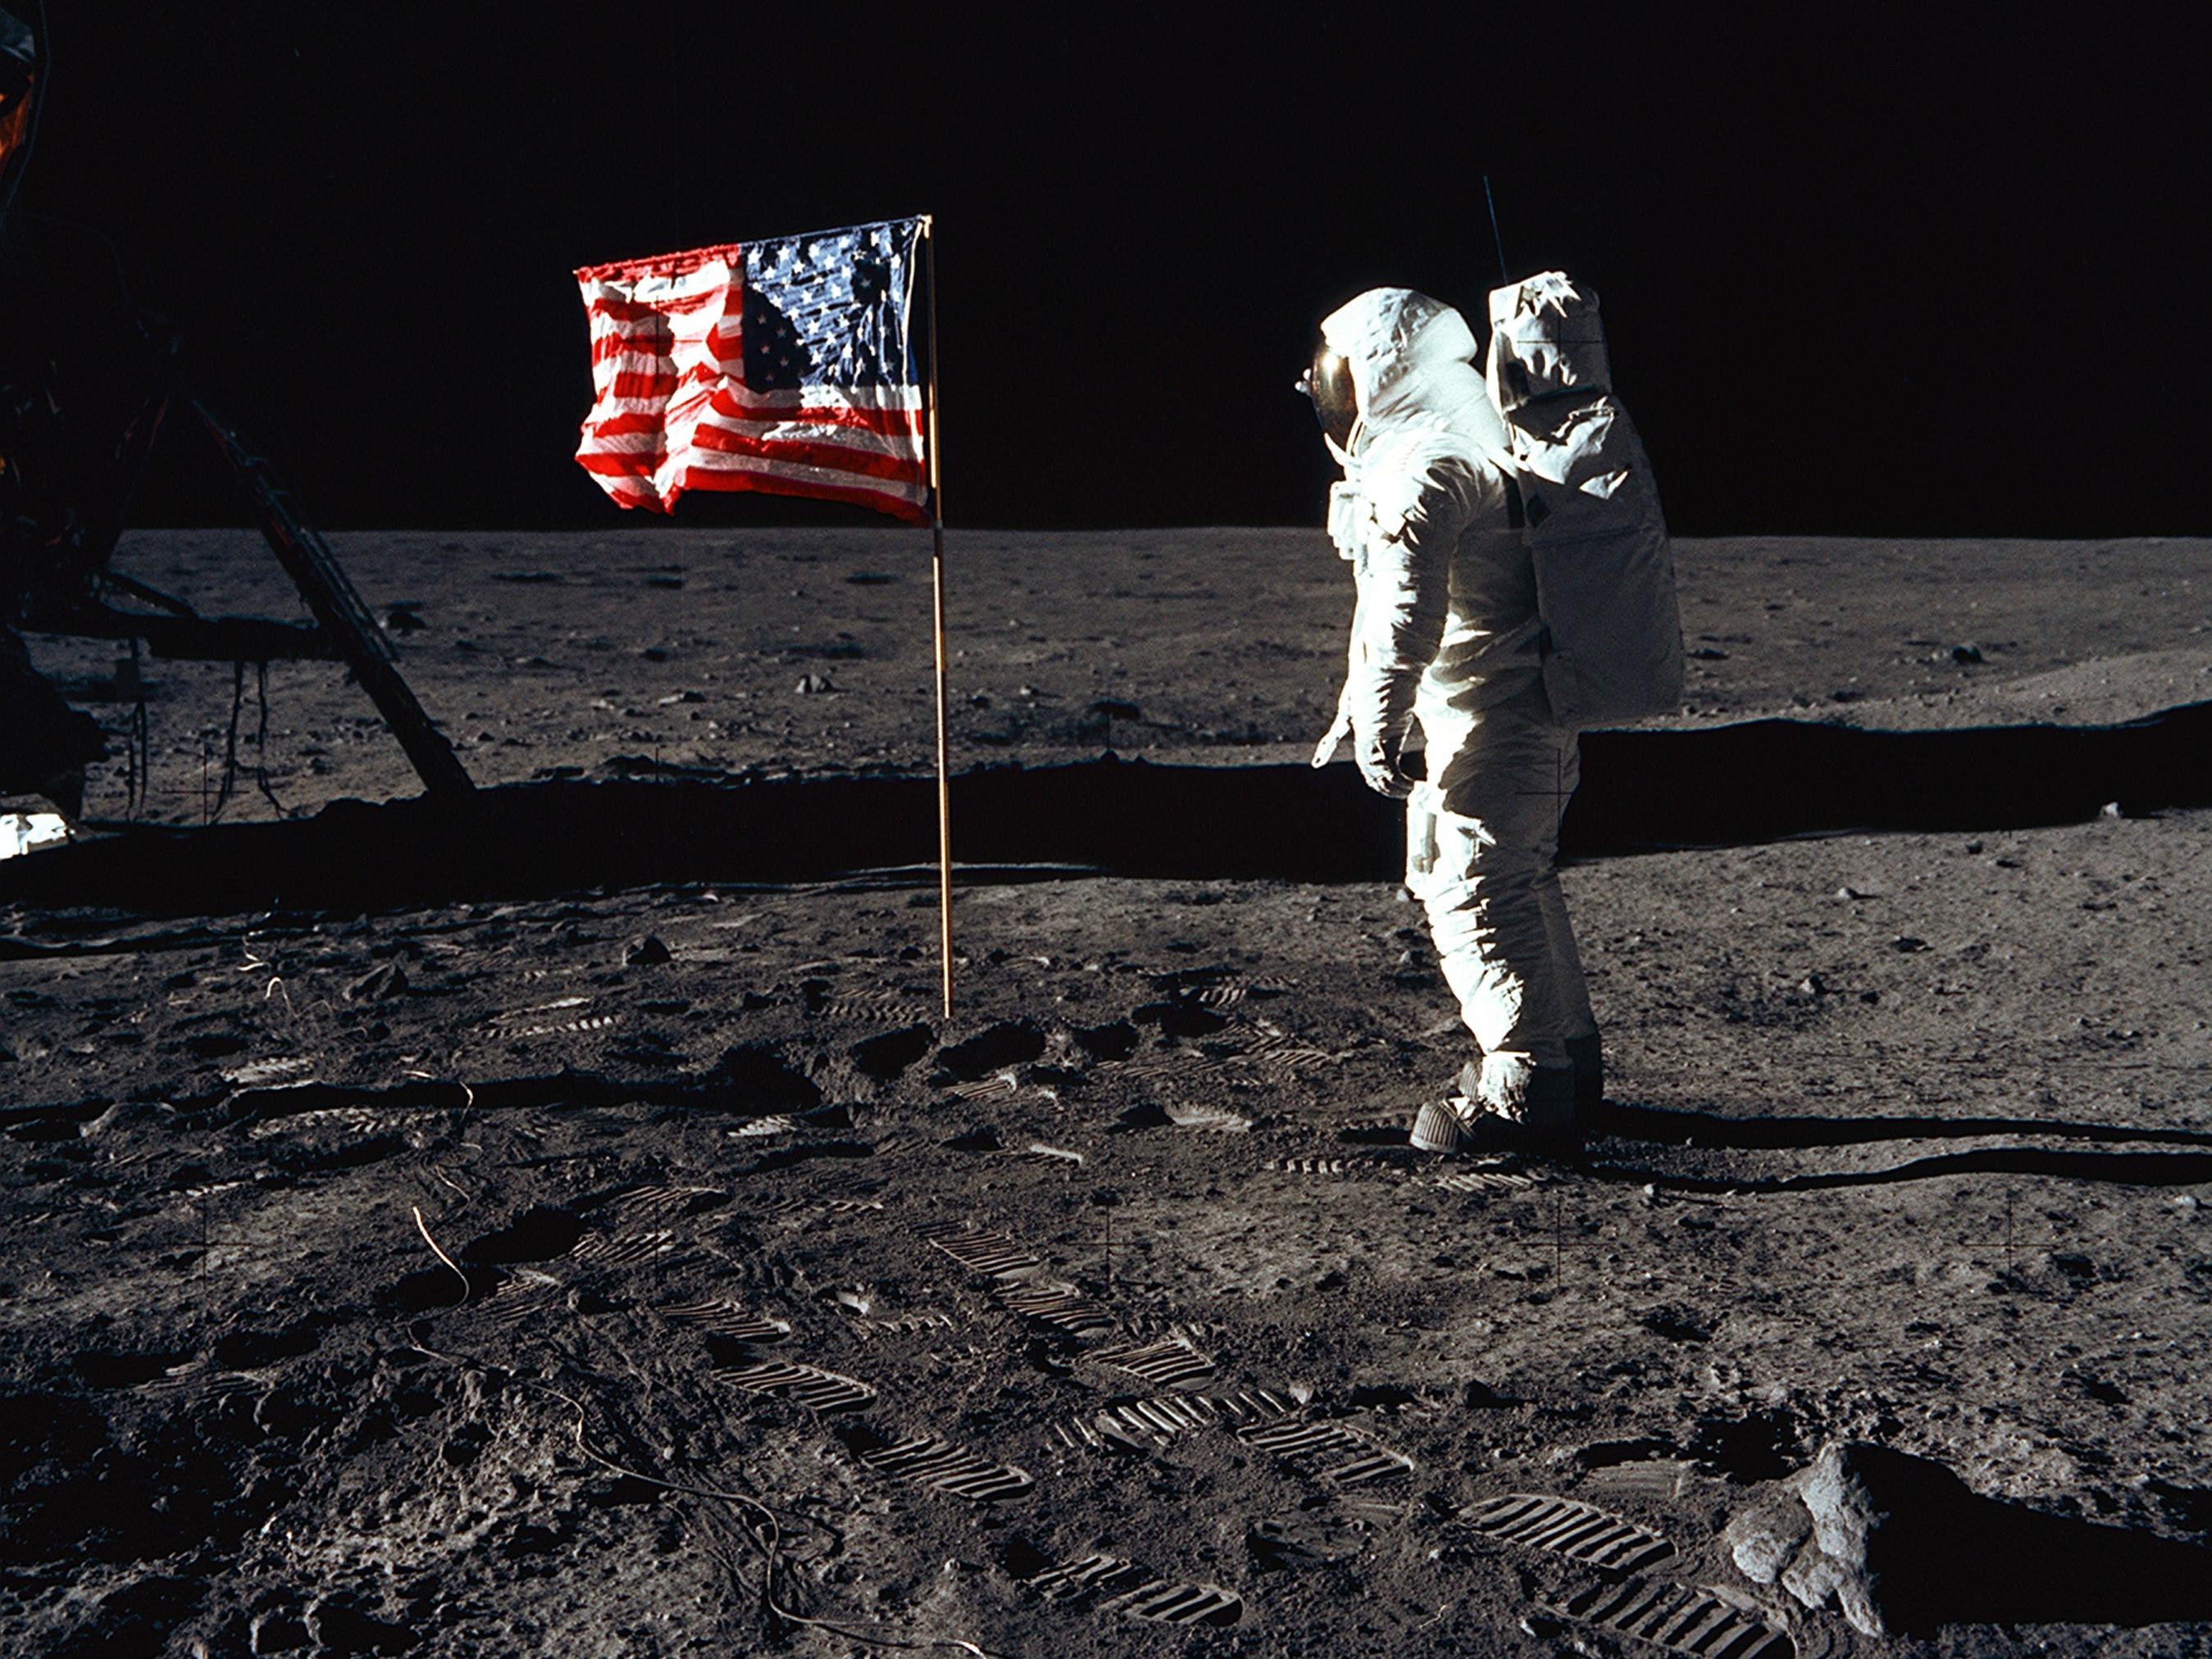
Old Glory saluted by first man on the moon.

Recent Comments